
Results of the FAIRagro survey on data quality
Why data quality?
In the age of modern agriculture, the amount of digital data is increasing every day. As a result, precise and reliable data is playing an increasingly important role and the topic of data quality is moving further into focus. But what exactly is data quality in the agricultural sciences? What challenges does it pose? And what is already being implemented? The results of the FAIRagro
survey “Data quality in the application of agricultural system data” shed light on this.
The participants
A total of 321 people took part in the survey, which was available online from 14.11.2023 to 21.01.2024. Of these, 211 were included in the analysis. The majority of participants came from research and mainly collected data in the plant and soil sector. Across all disciplines of agricultural science, impact, weather and omics data (“omics” as a generic term for molecular biological methods) are used most frequently.
The current challenges
The survey is divided into the two main areas of data collection and data utilisation. The biggest challenge for data quality in the area of data collection is by far the lack of time. In addition, there is a lack of standards in data collection, data quality and metadata. A lack of knowledge about data quality itself and the influence of environmental conditions are also mentioned. While we unfortunately cannot influence the weather in FAIRagro, we can provide information material on data quality and metadata.
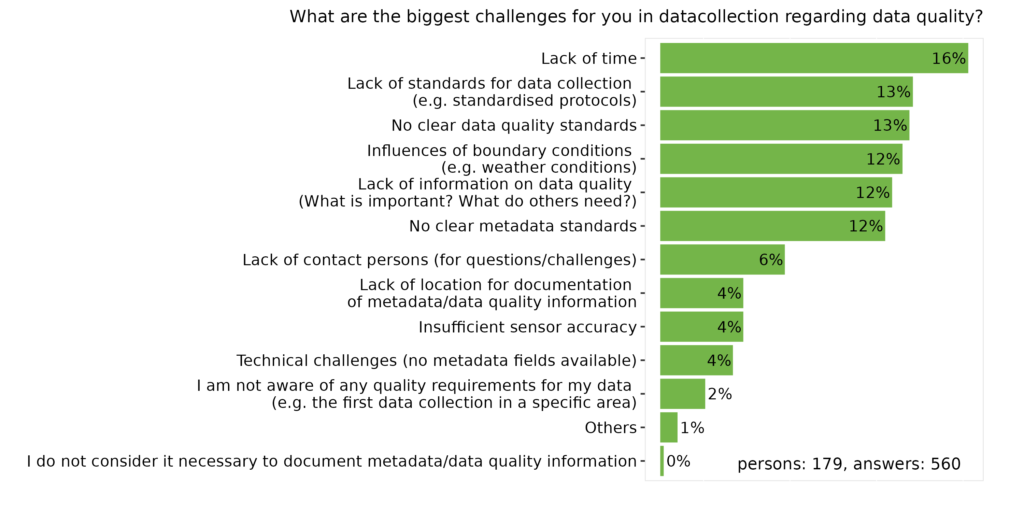
Figure 1: Answers to the multiple-choice question on current challenges in data collection with regard to data quality.
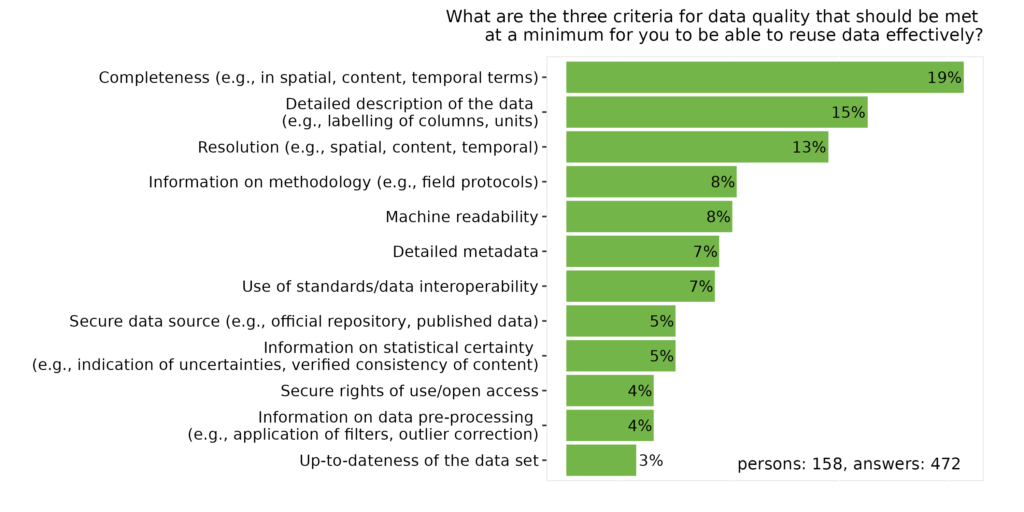
Criticism of the lack of metadata, the lack of standards and the lack of digital infrastructure is repeated as a challenge in the subsequent use of data. Instead, the participants want good documentation with consistent nomenclature and information on methodology and reproducibility as well as statistics and descriptions of the values and units. The data itself should be comparable with their own data, serve as a reliable data source and be authentic, interoperable and standardised.
The current status
Although the lack of information on data quality was criticised for data collection and subsequent data use, the majority of participants stated that they currently use methods to ensure data quality. Quality is primarily ensured through statistical analyses, standardised methods and protocols as well as multiple measurements. In addition, various other methods such as discussions with colleagues, manual checks and the calibration of instruments are regularly used. Overall, each person uses an average of more than four different methods to ensure data quality.
The data quality criteria
In both data collection and data utilisation, the most important criteria for data quality are completeness, a detailed description of the data and the resolution (spatial, content-related or temporal). In the combination of the various responses, it also became clear that the various quality criteria depend significantly on the data type, the data category and also the area of application.
Time
The majority of participants consider information on dataset performance to be helpful and the majority of these are willing to invest up to 2 hours per dataset in documenting it. This valuable assessment of time resources enables us to respond more specifically to the wishes and needs of those providing information in future.
The conclusion
For the first time, the survey captured the needs of data producers and users and defined the most important data quality criteria, although these depend heavily on the data type, category and area of application. The results also highlight the community’s desire for more standards and information on data quality. However, despite the numerous challenges and lack of time, various methods are already being used to ensure data quality.
Despite the initial assumptions, the results show that time and knowledge about data quality are available and that there is interest in the topic. The wording of the title therefore (fortunately) does not reflect reality when looking at the results. Instead, the survey results provide valuable insights into the needs of the community and enable us to take these into account in future materials, tools and workshops.
Once again, we would like to thank everyone who took part in the survey!
A comprehensive overview of the results can be found here: https://doi.org/10.5281/zenodo.11612449
Author: Jannes Uhlott (jannes.uhlott@julius-kuehn.de)